This article is based on the 2025 year-end US Mechanical Engineer Survey Results. Although specific, it gives insight into what other engineering fields experienced in 2025 and has set expectations for what we will see in 2026.
Number of US MEs Surveyed: 1,019 (across 41 US States)
Methodology:
Numbeo used NYC as 100, which, of course, skews every number high. Therefore, after looking through many different websites, I found that the average adjustment of NYC (which in Numbeo is 100) is 35% higher than the US median. This means that I basically just divided the COL number by 65, which means if you are higher than the median, the salary will be adjusted up. For instance, if the COL was 95 for SF, then 95/65 = 1.46, and a 100k salary/1.46 =68.5k
401K also had many issues. There was a variety of numbers and specific cases, so I just assumed pension was 5% if no number given, many of the 1-10 I assumed 1%-10%, 0.5 I assumed was 50% and etc. Maybe they were wrong, but some of the data were taken out, since they were outliers, and the goal was to find a general trend line for correlations with data.
Bonus was also the same, some bonuses were insanely high, 500k+ for lower base salary (200K), so I took those out to more center the data.
Survey Results:
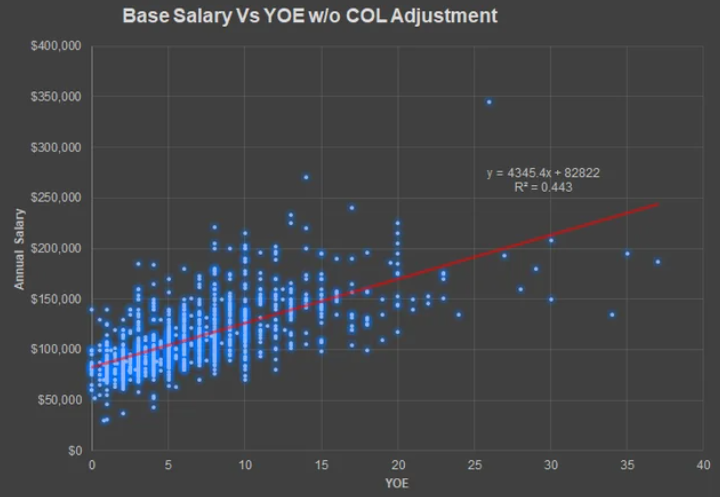
Section 1: Let's go with the base salary results with no adjustments.
Note: w/ just means with, w/o is just without. Here are the findings based on the trend-line:
Entry (0-1 YOE) = 83k/yr
Experienced (3-5 YOE -> using 4) = 100k/yr
Mid-level (7-10 YOE-> using 8.5) = 120k/yr
Senior/Advanced (10-15 YOE-> using 12.5) = 136.7k/yr
Principal (15-20 YOE -> 17.5) = 158.2k/yr
No good data after 20 YOE, so I didn't really count anything after that. It does seem like salary does go higher to 175k/yr+, but too few points for a conclusion
Conclusion: Endgame ME salary actually does not stop at 130k, after 18 YOE, it does reach 150k+/yr range. In other words, it's not as bad as everyone makes it out to be.
Section 2: Now let's do Total Overall Compensation (base + bonus +%401k match) with cost of living (COL) adjustment.
Here are the findings based on the trend-line:
Entry (0-1 YOE) = 91.4k/yr
Experienced (3-5 YOE -> using 4) = 115k/yr
Mid-level (7-10 YOE-> using 8.5) = 141.6k/yr
Senior/Advanced (10-15 YOE-> using 12.5) = 165.1k/yr
Principal (15-20 YOE -> 17.5) = 194.5k/yr
No good data after 20 YOE, so I didn't really count anything after that. It does seem like TOC does go higher to 250k/yr+, but too few points for a conclusion
Conclusion: Endgame ME TOC actually does not stop at 150k, after 18 YOE, it does reach 200k+/yr range.
Section 3: How far is the data skewed by high-earning industries such as FANG or O&G?
Here is the graph for Aerospace/Defense and Manufacturing, which basically is about: 566 salary data. They are not known for high salaries:
Here are the findings based on the trend-line:
Entry (0-1 YOE) = 81k/yr
Experienced (3-5 YOE -> using 4) = 97.8k/yr
Mid-level (7-10 YOE-> using 8.5) = 116.7k/yr
Senior/Advanced (10-15 YOE-> using 12.5) = 133.3k/yr
Principal (15-20 YOE -> 17.5) = 154.5k/yr
Conclusion: Endgame ME salary actually does not stop at 130k, after 18 YOE, it does reach 150k+/yr range. In other words, it's not as bad as everyone makes it out to be.
Here are the findings based on the trend-line:
Entry (0-1 YOE) = 83.9k/yr
Experienced (3-5 YOE -> using 4) = 104.7k/yr
Mid-level (7-10 YOE-> using 8.5) = 128.2k/yr
Senior/Advanced (10-15 YOE-> using 12.5) = 149.1k/yr
Principal (15-20 YOE -> 17.5) = 175.1k/yr
Conclusion: Endgame ME TOC actually does not stop at 150k, after 18 YOE, it does reach 200k+/yr range. In other words, it's not as bad as everyone makes it out to be.
Section 4: What are the highest paying industries: Tech & Oil & Gas remains the top:
For Tech Only: Here are the findings based on the trend-line:
Entry (0-1 YOE) = 87k/yr
Experienced (3-5 YOE -> using 4) = 116.8k/yr
Mid-level (7-10 YOE-> using 8.5) = 150.4k/yr
Senior/Advanced (10-15 YOE-> using 12.5) = 180.3k/yr
Principal (15-20 YOE -> 17.5) = 217.7k/yr
Conclusion: Tech still pays top dollar still. Looks like the base salary continue to goes up to 225k+/yr.
For Tech Only: Here are the findings based on the trend-line:
Entry (0-1 YOE) = 78k/yr
Experienced (3-5 YOE -> using 4) = 125.5k/yr
Mid-level (7-10 YOE-> using 8.5) = 179.2k/yr
Senior/Advanced (10-15 YOE-> using 12.5) = 227k/yr
Principal (15-20 YOE -> 17.5) = 286.6k/yr
Conclusion: Tech still pays top dollar even with insane COL adjustment, which is about 35% down for NYC and 30% down for San Fransisco. Looks like the TOC continue to goes up to 300k+/yr.
Oil and Gas will remain a close 2nd:
For Oil & Gas Only: Here are the findings based on the trend-line:
Entry (0-1 YOE) = 82.4k/yr
Experienced (3-5 YOE -> using 4) = 104.5k/yr
Mid-level (7-10 YOE-> using 8.5) = 129.4k/yr
Senior/Advanced (10-15 YOE-> using 12.5) = 151.5k/yr
Principal (15-20 YOE -> 17.5) = 179.1k/yr
Conclusion: Oil & Gas Pays top dollar. Looks like the base salary continue to goes up to almost 200k+/yr.
For Tech Only: Here are the findings based on the trend-line:
Entry (0-1 YOE) = 84.9k/yr
Experienced (3-5 YOE -> using 4) = 125.7k/yr
Mid-level (7-10 YOE-> using 8.5) = 171.6k/yr
Senior/Advanced (10-15 YOE-> using 12.5) = 212.4k/yr
Principal (15-20 YOE -> 17.5) = 263.4k/yr
Conclusion: Oil & Gas still pays top dollar probably with the help of the COL adjustment, since the places are more rural and increases the relative salary. Looks like the TOC continue to goes up to 250k+/yr.
Section 5: What are the findings on job hops. This remains a bit more difficult, since I could only pick the same YOE and number of job hops. Therefore, I only used the 5 and 10 YOE vs number of job hops since they the most data and only for Aerospace/defense and Manufacturing so outliers will not skew the data.
Conclusion: So kind of weird that for younger employees, they are jumping more. Nonetheless, it does seem for the same industry, job hoping does seem to give 3k/job hop for 5 YOE and 6k/job hop for 10 YOE. Therefore, it does make sense for job hops.
Section 6: What is the average PTO (so many was unlimited, which is very hard to count. I will just give a percentage of unlimited and then graph the rest:
Entry (0-1 YOE) = 16.5 days (which includes sick days, but not holidays which is 10 days in US)
Experienced (3-5 YOE -> using 4) = 18.3 days
Mid-level (7-10 YOE-> using 8.5) = 20.3 days
Senior/Advanced (10-15 YOE-> using 12.5) = 22 days
Principal (15-20 YOE -> 17.5) = 24.2 days
Total Unlimited is 158/1026 or 15.4%
Conclusion: So US doesn't have that bad vacation schedule. Most start at 15 days+ at entry and it slowly builds up to around 20 days after 15 YOE. Adding 10 days which is 30 days, basically like a month of vacation, so it's not that bad. 15%+ has unlimited, which like my company is around 6-8 weeks, unless you are leadership and maybe can negotiate more.
Section 7: Average work hours in US:
Conclusion: most work 40 hours a week 80%+.
Section 8: % remote vs. in Office
Conclusion: It seems that about 30%+ is 100% in person, with little or no remote possibility. Just for reference, for 100% remote it was about 7% of the workers.
Section 8: % 401k Match
Conclusion: It seems that most of the 401k match is around 2.5% - 6% with some outliers at the tail end.
Data Analysis Insight: US BLS says the median wage for all ME in US is $99.5k/yr in 2023, so you can just assume 100k/yr in 2024. The median income in our survey is 103k/yr. Now, let's account for age, so the median age of our survey is 29 vs in US is 40. Now, we don't have enough data for those around 40, but you could estimate based on 18 YOE, which has a median salary of #131k/yr. Now, US BLS says $157k/yr is top 10% and $64.5k/yr is bottom 10% so assuming an power curve since that is how salaries are skewed, 131k/yr is about the 73.6% percentile or slightly less than the top 25% of ME. In short, the survey represents the top 26.4% of ME in the US.
Credit: yaoz889 - r/MechanicalEngineering